AWS EC2 Instance auto discovery in Prometheus

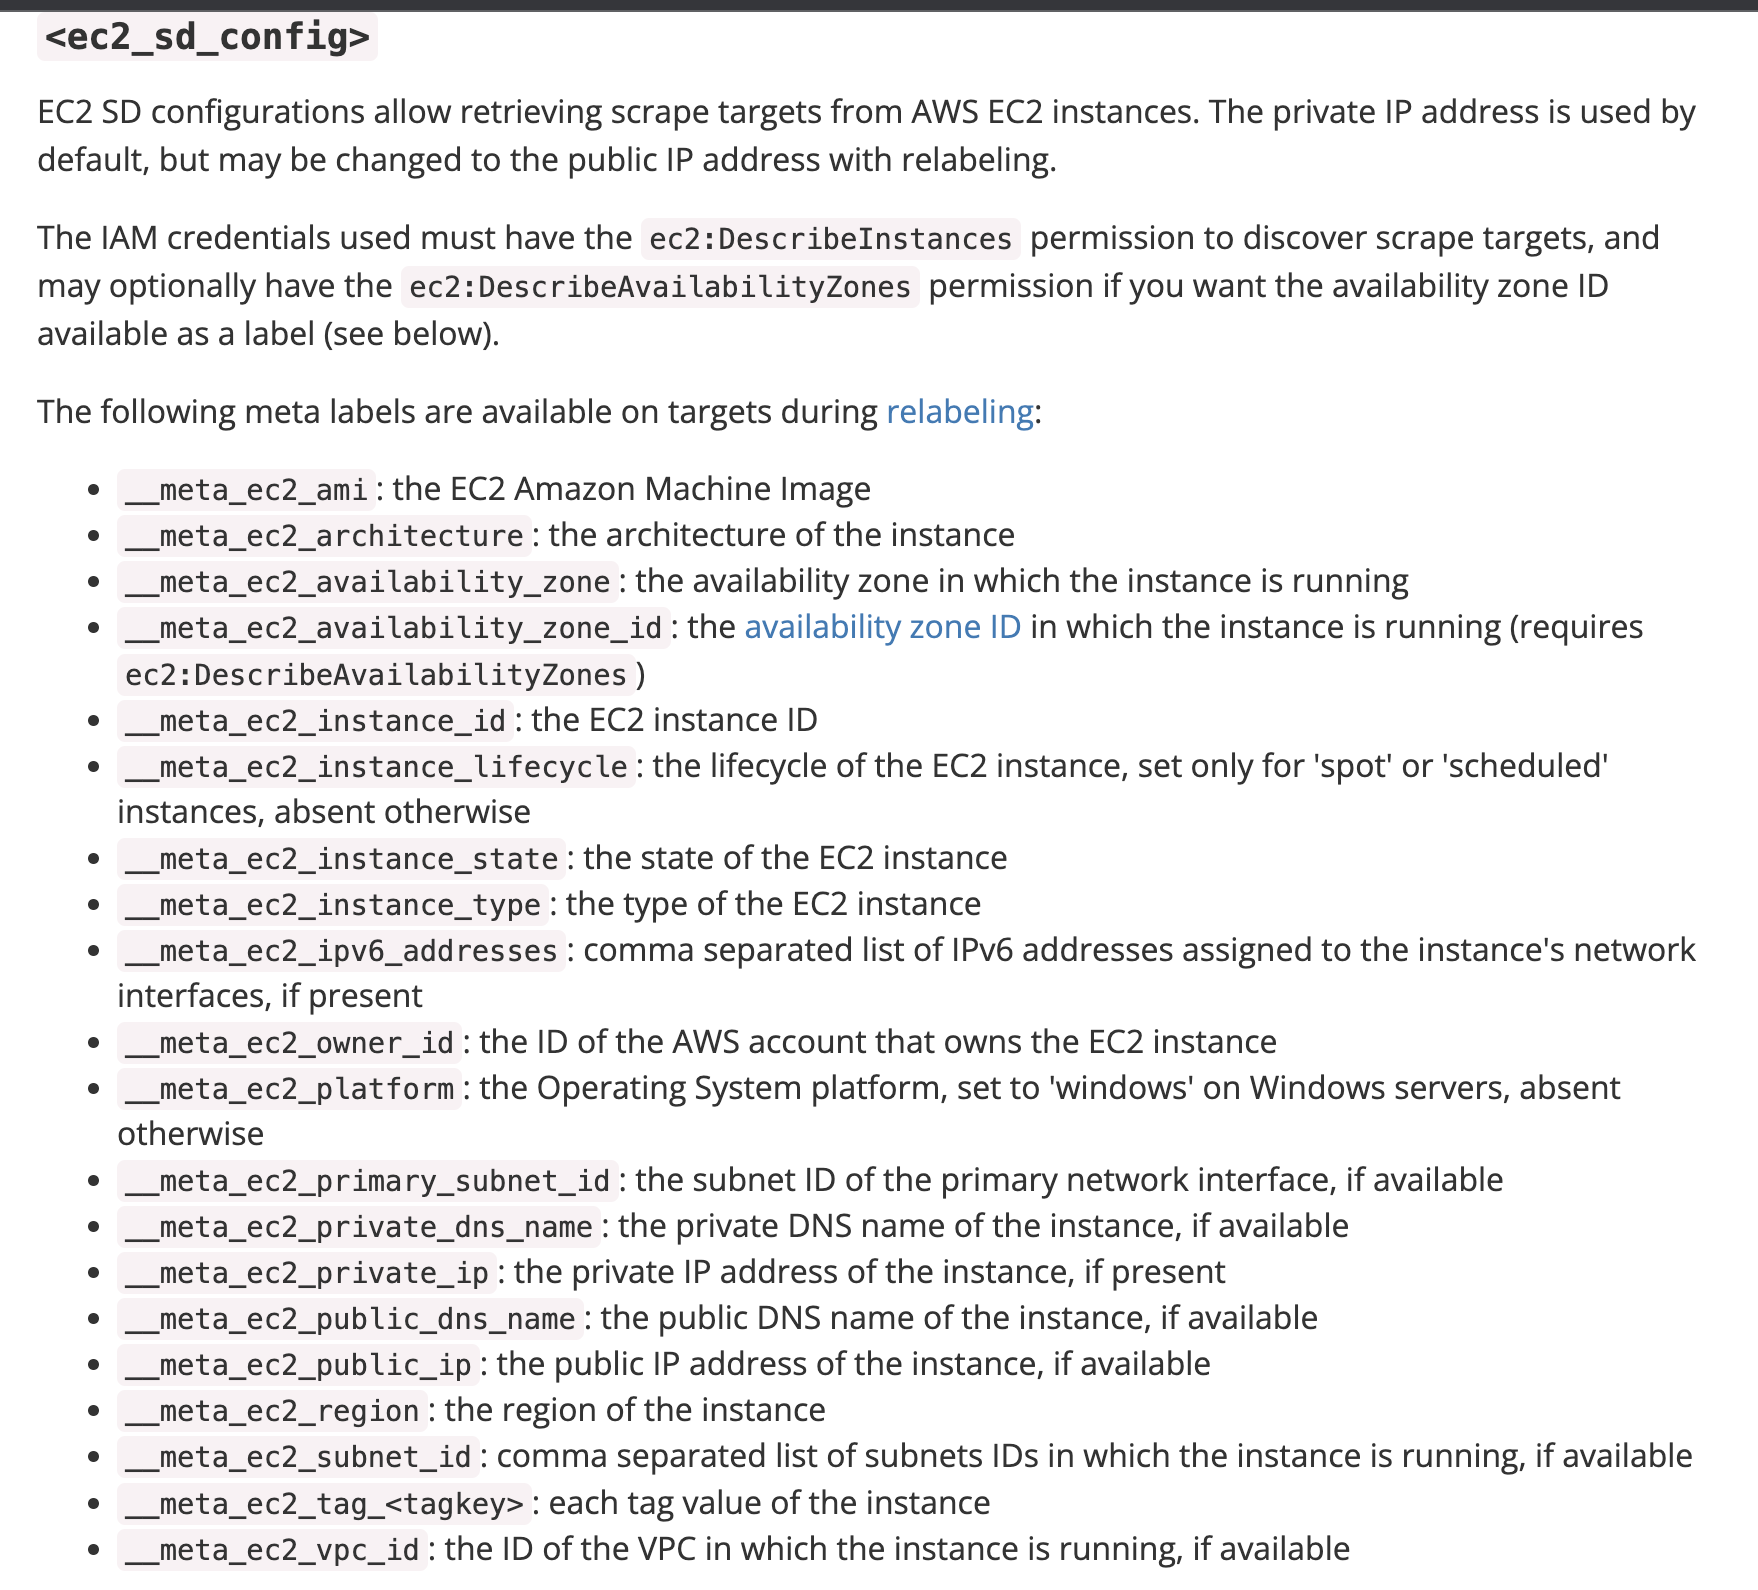
Prometheus monitor is allowing you to automatically discover all the EC2 instances through the node_exporter and monitor the metrics in one grafana graph. The Prometheus based discovery of AWS EC2 instances is very easy and ec2_sd_configs allow retrieving scrape targets.

Node exporter

It is a prometheus exporter for hardware and OS metrics exposed by *NIX kernels, written in Go with pluggable metric collectors. Install node_expoter and ensure the EC2 instances running with ports 9100 and 9090 were open in the Security Group.

How to configure AWS EC2 auto discovery in Prometheus

Create an IAM User

  • First, select IAM from the AWS Services and Click Users from the sidebar menu.
  • Click on Add user button
  • Click user and Generate AWS access key and Secret keys

Save the generated keys in a safe place. It is really important to keep these keys in a safe place.
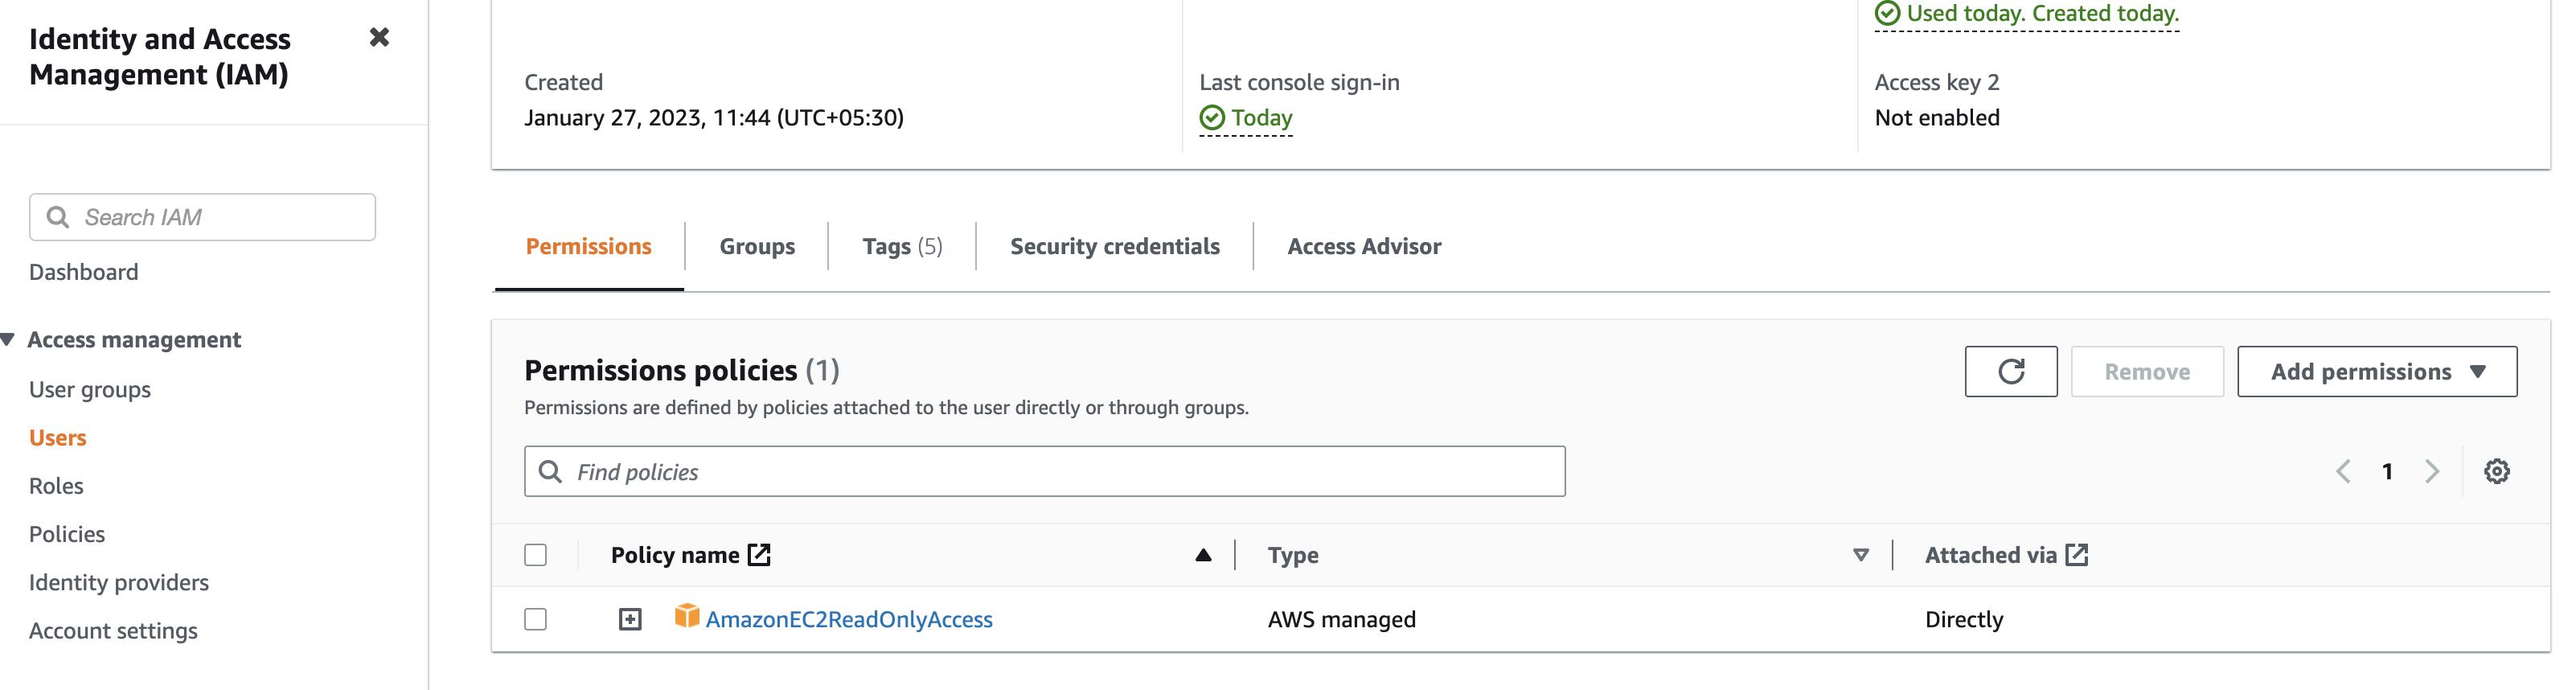
Setup Policy

Set permissions for the new user. At this point, the new user is not capable to do nothing. Attach an existing policy using the filter and looking for AmazonEC2ReadOnlyAccess.

Configure AWS EC2 Instance auto discovery 

Now go to your prometheus server and updated the configuration file.

  • Edit /etc/prometheus/prometheus.yml file and update the below settings in your existing scrap configuration.
scrape_configs:
  - job_name: 'nodeexporter'
    ec2_sd_configs:
      - region: ap-south-1
        access_key: PUT_THE_ACCESS_KEY_HERE
        secret_key: PUT_THE_SECRET_KEY_HERE
        port: 9100
    relabel_configs:
      - source_labels: [__meta_ec2_tag_Name]
        target_label: instance
  • Reload your prometheus
curl -X POST <prometheus_host>:9090/-/reload

Go to your prometheus console > status > targets and all you discovered EC2 instances are registered and being scraped for metrics.

http://gopal-prometheus-metric-monitoring:9090/targets

Example configuration to fetch only the selected instances.

Relabelling gives you the power to customise what labels Prometheus applies to your target. For an example, to discover only the particular Tag name and label, I put the following into /etc/prometheus/prometheus.yml and reloaded Prometheus:

    relabel_configs:
    # Only monitor instances with a Name starting with “demo website”
      - source_labels: [__meta_ec2_tag_Name]
        regex: demo website.*
        action: keep
        # Use the instance ID as the instance label
      - source_labels: [__meta_ec2_instance_id]
        target_label: instance

How to discover EC2 metrics using fluent-bit agent?

Use the below simple steps to install Fluentbit and configurations.

# Direct curl command to install the agent

curl https://raw.githubusercontent.com/fluent/fluent-bit/master/install.sh | sh

# Move the existing configuration file and update the config with your custom port 2021 or IP address.

mv  /etc/fluent-bit/fluent-bit.conf  /etc/fluent-bit/fluent-bit.conf-$(date +'%d-%m-%Y-%s')
cat << EOF | sudo tee  /etc/fluent-bit/fluent-bit.conf 
[SERVICE]
        flush 1
        log_level info


[INPUT]
        name node_exporter_metrics
        tag node_metrics
        scrape_interval 2


[OUTPUT]
        name prometheus_exporter
        match node_metrics
        host 0.0.0.0
        port 2021
EOF
#  systemctl restart fluent-bit

You are almost done. Go back to the top and follow the prometheus configuration /etc/prometheus/prometheus.yml file.


Simple SSL Certificate Expiry Monitoring in Zabbix

To monitor SSL certificate expiry dates in Zabbix, a simple SSH script will execute the SSL certificate check and update the date. SSL expires at various times and it can be quite hard to manage. Zabbix HTTPS Certificate Monitoring is available with zabbix-agent2 that works without any external scripts but if you want to continue with our existing zabbix agent, the below simple script is advisable with single items.

SSL Certificate Expiry Monitoring

Login to your Zabbix agent host SSH.

Go to /etc/zabbix/zabbix_agentd.conf.d directory which is the common for zabbix and named the file checkssl.sh

$sudo vim  checkssl.sh
data=`echo | openssl s_client -servername $1 -connect $1:443 2>/dev/null | openssl x509 -noout -enddate | sed -e 's#notAfter=##'`

ssldate=`date -d "${data}" '+%s'`
nowdate=`date '+%s'`
diff="$((${ssldate}-${nowdate}))"

echo $((${diff}/86400))

then give it execute permissions.

$ sudo chmod 755 checkssl.sh

then test SSL certificate expiry for various websites we manage, and also many others. 

For example,

$ ./checkssl.sh cloudkb.net
$ ./checkssl.sh github.com

The command should return a number indicating how many days are left before the SSL certificate expires.

Check SSL Expire date

This script can be called any way you like for the particular use case. Now, Let us enable “EnableRemoteCommands=1” in /etc/zabbix/zabbix_agentd.conf

$ sudo vim /etc/zabbix/zabbix_agentd.conf

And set EnableRemoteCommands=1

Restart the Zabbix agent

$ sudo systemctl restart zabbix-agent

How to configure in Zabbix Server?

Let us open zabbix server web page and configure the host items.

Configuration -> Select Hosts -> Click Items, and then press the Create Item button to get the new item configuration.

And fill in the details as seen in this image.

Zabbix SSL Check Item

For example, System run settings.

Key : system.run[/etc/zabbix/zabbix_agentd.conf.d/checkssl.sh localhost]

Or 

Key : system.run[/etc/zabbix/zabbix_agentd.conf.d/checkssl.sh <your_website>]

Type of information: Numeric (float)

After saving, select the new item you created, and press the Test button.

Then Goto, Monitoring -> Host -> Latest Data and filter for the host you added the item to, and after “Update Interval” which you configured should see a new property appear somewhere in the list titled SSL Check.

Now you can configure the triggers to alert when the expiry days remain below 30 days or whatever you decide is important.

Example,

Zabbix SSL check Triggers

You can copy the existing trigger and modify the date that you want. Update your comments if you have any troubles.

Use the below SSL Certificate Expire check in Zabbix Template.


Integrate Pagerduty with Zabbix Monitoring

This guide describes how to integrate your Zabbix 4.4 installation with PagerDuty using the Zabbix webhook feature. This guide will provide instructions on setting up a media type, a user, and an action in Zabbix.

Why PagerDuty

  • You can send notifications through the various integrated collaboration tools that PagerDuty supports, including SMS, push notifications, phone calls, and email.
  • Monitoring teams can reach out to the subject matter expert, who can help resolve customer critical infra issues.
  • PagerDuty provides flexibility by having rotating on-call schedules based on business hours shift, overnight on-call shift, and weekend shift so reaching out to the appropriate engineer can be achieved seamlessly. 

In PagerDuty

1. From the Configuration menu, select Services.

2. On your Services page:

  • If you are creating a new service for your integration, click +New Service.

  • If you are adding your integration to an existing service, click the name of the service you want to add the integration to. Then click the Integrations tab and click the +New Integration button.

3. Select Use our API directly and Events API v2 from the Integration Type menu and enter an Integration Name. If you are creating a new service for your integration, in General Settings, enter a Name for your new service.

4. Click the Add Service or Add Integration button to save your new integration. You will be redirected to the Integrations page for your service.

5. Copy the Integration Key for your new integration:

In Zabbix

The configuration consists of a media type in Zabbix, which will invoke webhook to send alerts to PagerDuty through the PagerDuty Event API v2. To utilize the media type, we will create a Zabbix user to represent PagerDuty. We will then create an alert action to notify the user via this media type whenever there is a problem detected.

Create Global Macro

1. Go to the Administration tab.

2. Under Administration, go to the General page and choose the Macros from drop-down list.

3. Add the macro {$ZABBIX.URL} with Zabbix frontend URL.

4. Click the Update button to save the global macros.

Create the PagerDuty media type

1. Go to the Administration tab.

2. Under Administration, go to the Media types page and click the Import button.

3. Select Import file media_pagerduty.yaml and click the Import button at the bottom to import the PagerDuty media type.

4. Change the value of the variable token

Create the PagerDuty user for alerting

1. Go to the Administration tab.

2. Under Administration, go to the Users page and click the Create user button.

3. Fill in the details of this new user, and call it “PagerDuty User”. The default settings for PagerDuty User should suffice as this user will not be logging into Zabbix.

4. Click the Select button next to Groups.

  • Please note, that in order to notify of problems with the host this user must have at least read permissions for the such host.

5. Click on the Media tab and, inside of the Media box, click the Add button.

6. In the new window that appears, configure the media for the user as follows:

  • For the Type, select PagerDuty (the new media type that was created).
  • For Send to: enter any text, as this value is not used, but is required.
  • Make sure the Enabled box is checked.
  • Click the Add button when done.

7. Click the Add button at the bottom of the user page to save the user.

8. Use the PagerDuty User in any Actions of your choice.

For more information, use the Zabbix and PagerDuty documentation.